Could you be happier at work?
Take our quiz and find out! It takes just five minutes and you'll get a data-packed report afterwards.
Reporting features in Friday
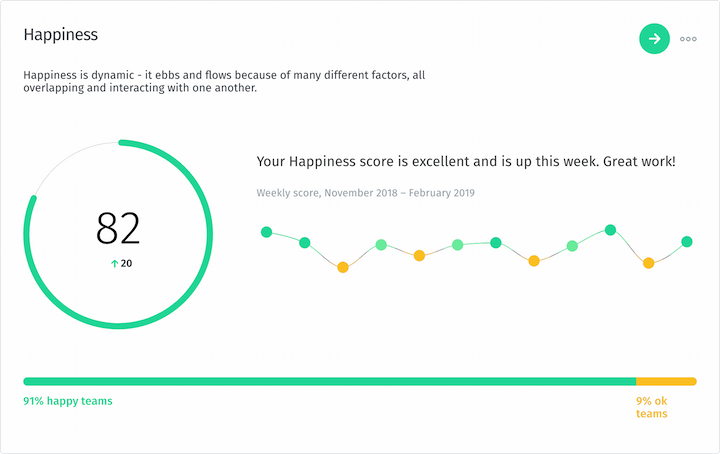
Friday’s Reports (Reports area) are designed to help you understand and use your Happiness data
Topic groups
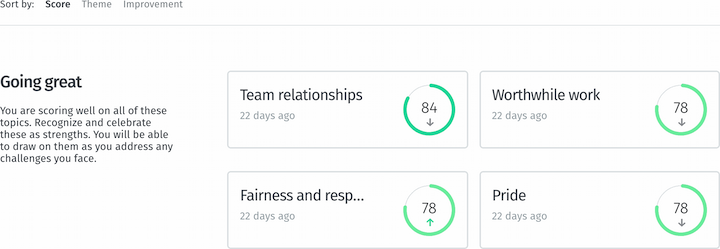
On the Overview page you can group your Culture Profile topics by Score, by Theme or by Improvement. In the Help Center you can find articles with in-depth information about each topic. For instance, you can learn more about the importance of Worthwhile work and what you can do to improve your score.

Focusing on teams
Teams are critical to generating and maintaining momentum for positive change in organizations. Because of this, each topic area score shows the breakdown of percentages of happy, OK and unhappy teams. This focus on teams also helps to further protect the anonymity of individuals.

Participation data
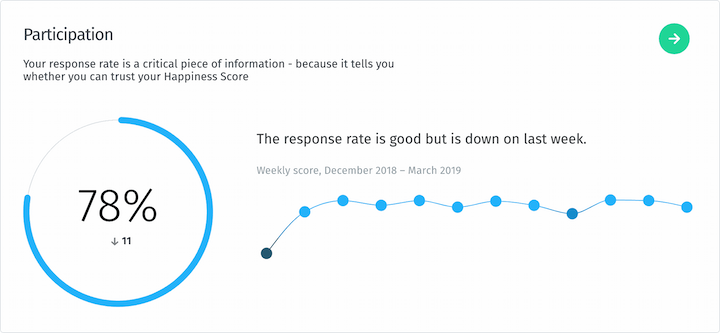
You can now easily see your participation trend data to enable you to take action if your response rates start to slip. The Participation Report lets you quickly identify teams with low response rates so you can encourage them to participate more.

Heatmap
Our Heatmap gives you a complete overview of your organization’s scores. Using it, you can see at a glance which teams are struggling and which topics need attention as well as your strengths across the organization.

Impact report
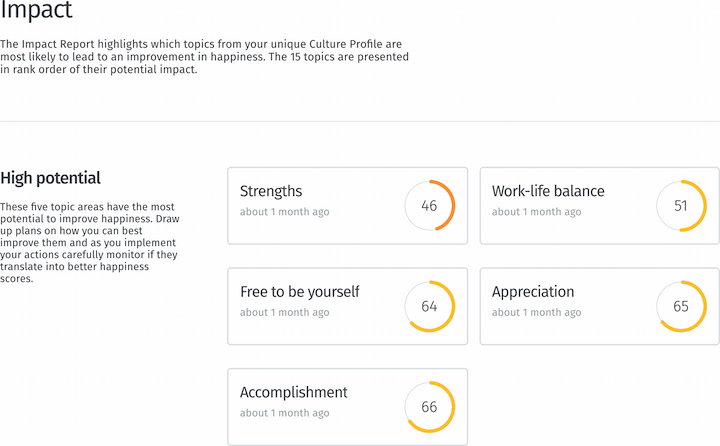
Our unique Impact report uses our extensive research data to help you identify and focus on the topics that are most likely to improve your team's happiness. Find out more about the Impact report here.

Benchmarks
We have Benchmark data for all the questions that cover our 15 topics in your culture profile: About our benchmark variables Benchmarks are available for eight locations, 14 sectors and a range of organizational sizes. Our benchmarks are calculated from a series of nationally representative surveys of over 22,000 workers.
PDF reports
We know that sometimes it just feels easier to share and discuss your happiness on paper. We have an Organization PDF Report which includes all our reporting pages in an easily downloadable and readable format. To download the report, click on the ellipses on the Reports Overview page.