Could you be happier at work?
Take our quiz and find out! It takes just five minutes and you'll get a data-packed report afterwards.
Using your response rate data
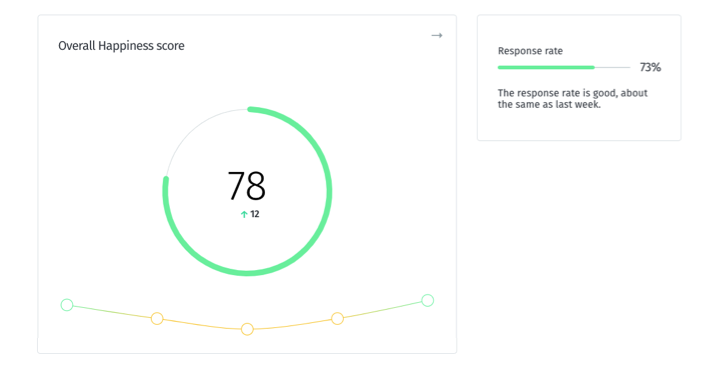
The response rate will tell you if the score reflects the majority view, which is important for knowing whether an experience is common across a lot of people.
Validate scores by checking the response rate
It’s good practice to check a score against that question’s response rate. It’s also good practice to check response rates when comparing scores through time. Are changes reflecting real shifts in people’s experience or a change in the percentage of people who responded to a question?
If you are uncertain about the influence a change in response rate is having on your scores, monitor the score over more measures. This will tell you whether changes in score and changes in response rate are related.
You can also discuss response rate data with one of our experts in your quarterly Results Review call.

Share response rate data
The response rate report ranks teams by their participation, with the highest at the top.
We find clients who share the response rate report with the whole organization do so to: - Signal that participation is valued - Celebrate those teams who are actively reflecting on happiness - Encourage low responding teams to use happiness data to improve team culture
This is great! Organizations that improve culture do so by learning from their own experiences and the wider research. This can be achieved through participation in Friday Pulse.
So, shout about the teams who are taking happiness seriously – they are your first followers, who will bring others with them.