Understanding your Participation report
Your response rate data are important pieces of information because they show whether your scores reflect how most people feel. It allows you to trust your results and act with confidence.
The Participation report, available to Admin, Analyst and Senior leader users, provides you with information about your organization’s response rates overall, as well as showing the data broken down into teams, locations, tags, age and tenure.
We recommend aiming for an 80% response rate for your organization and for each team.
The first score in your report is your overall response rate, alongside the trend line showing the rate across time.
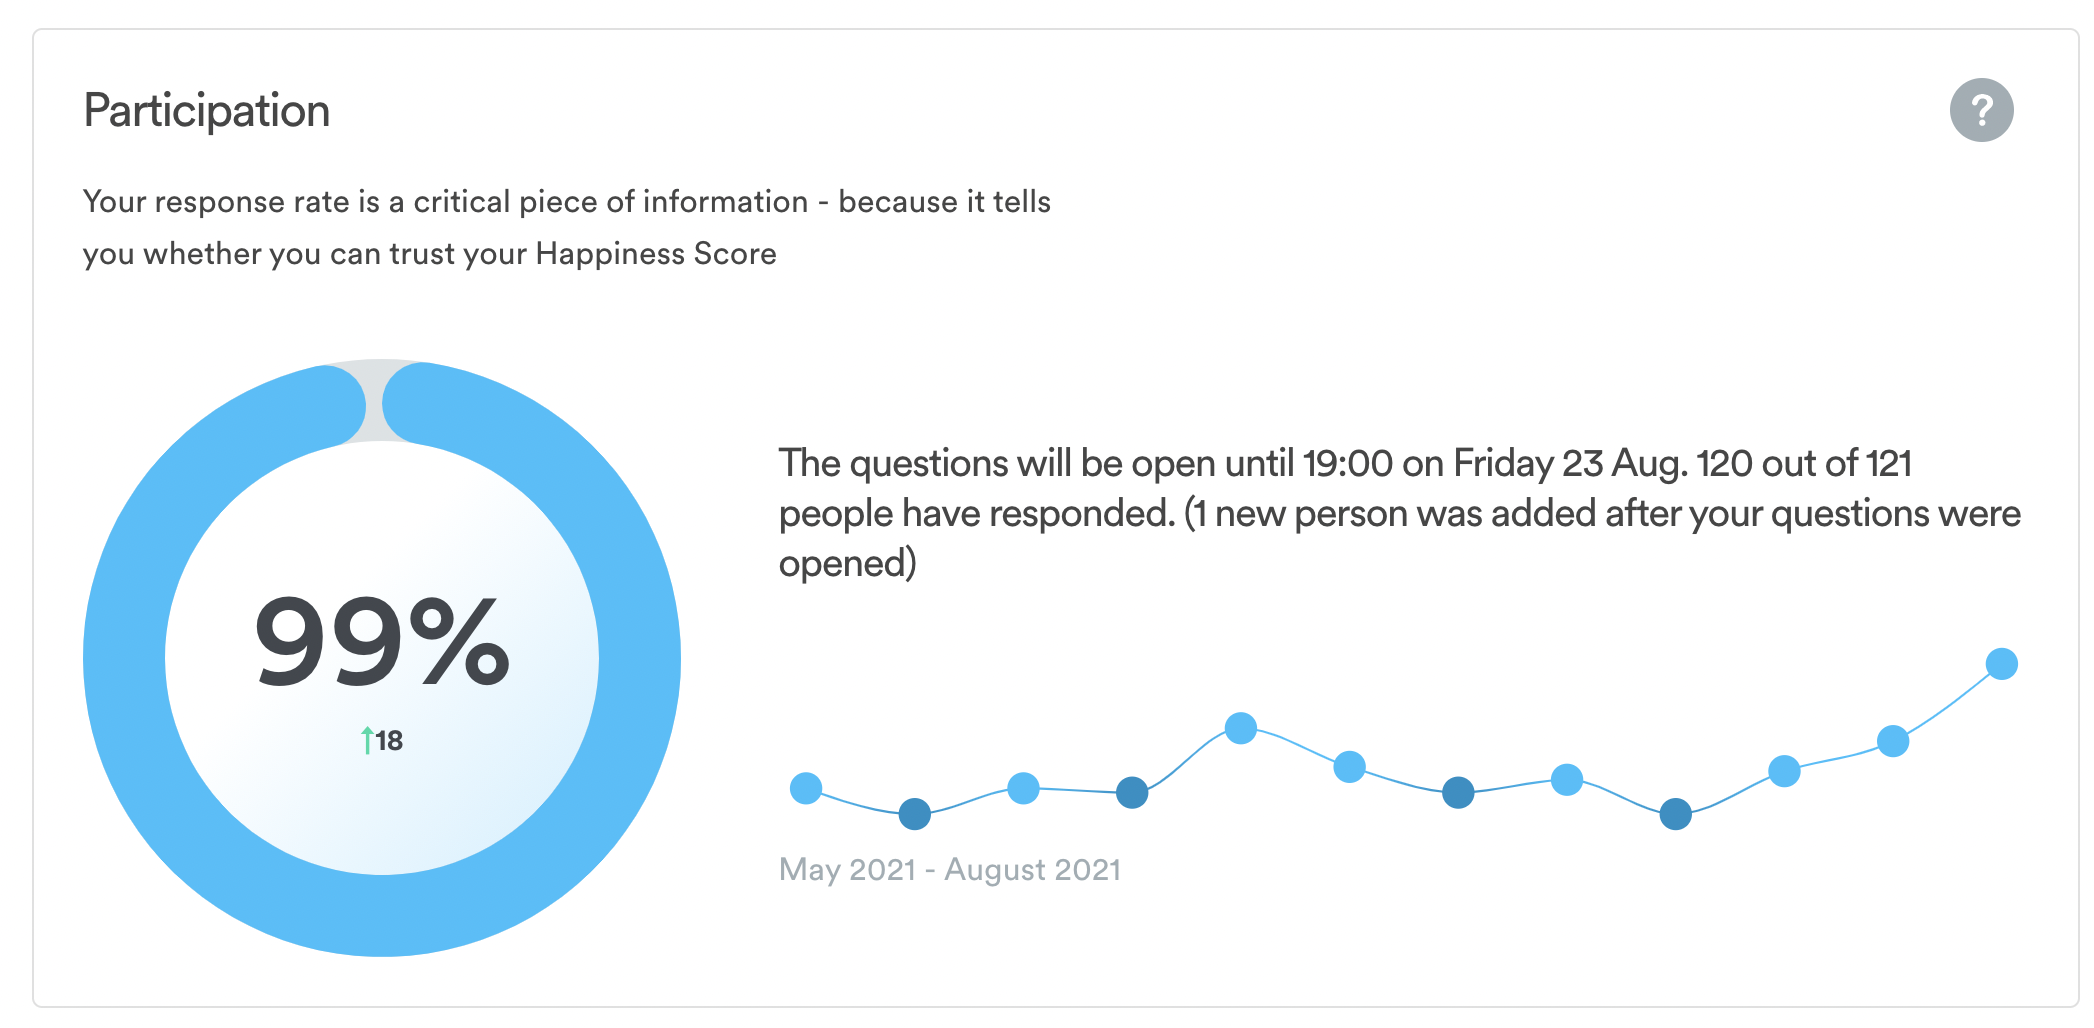
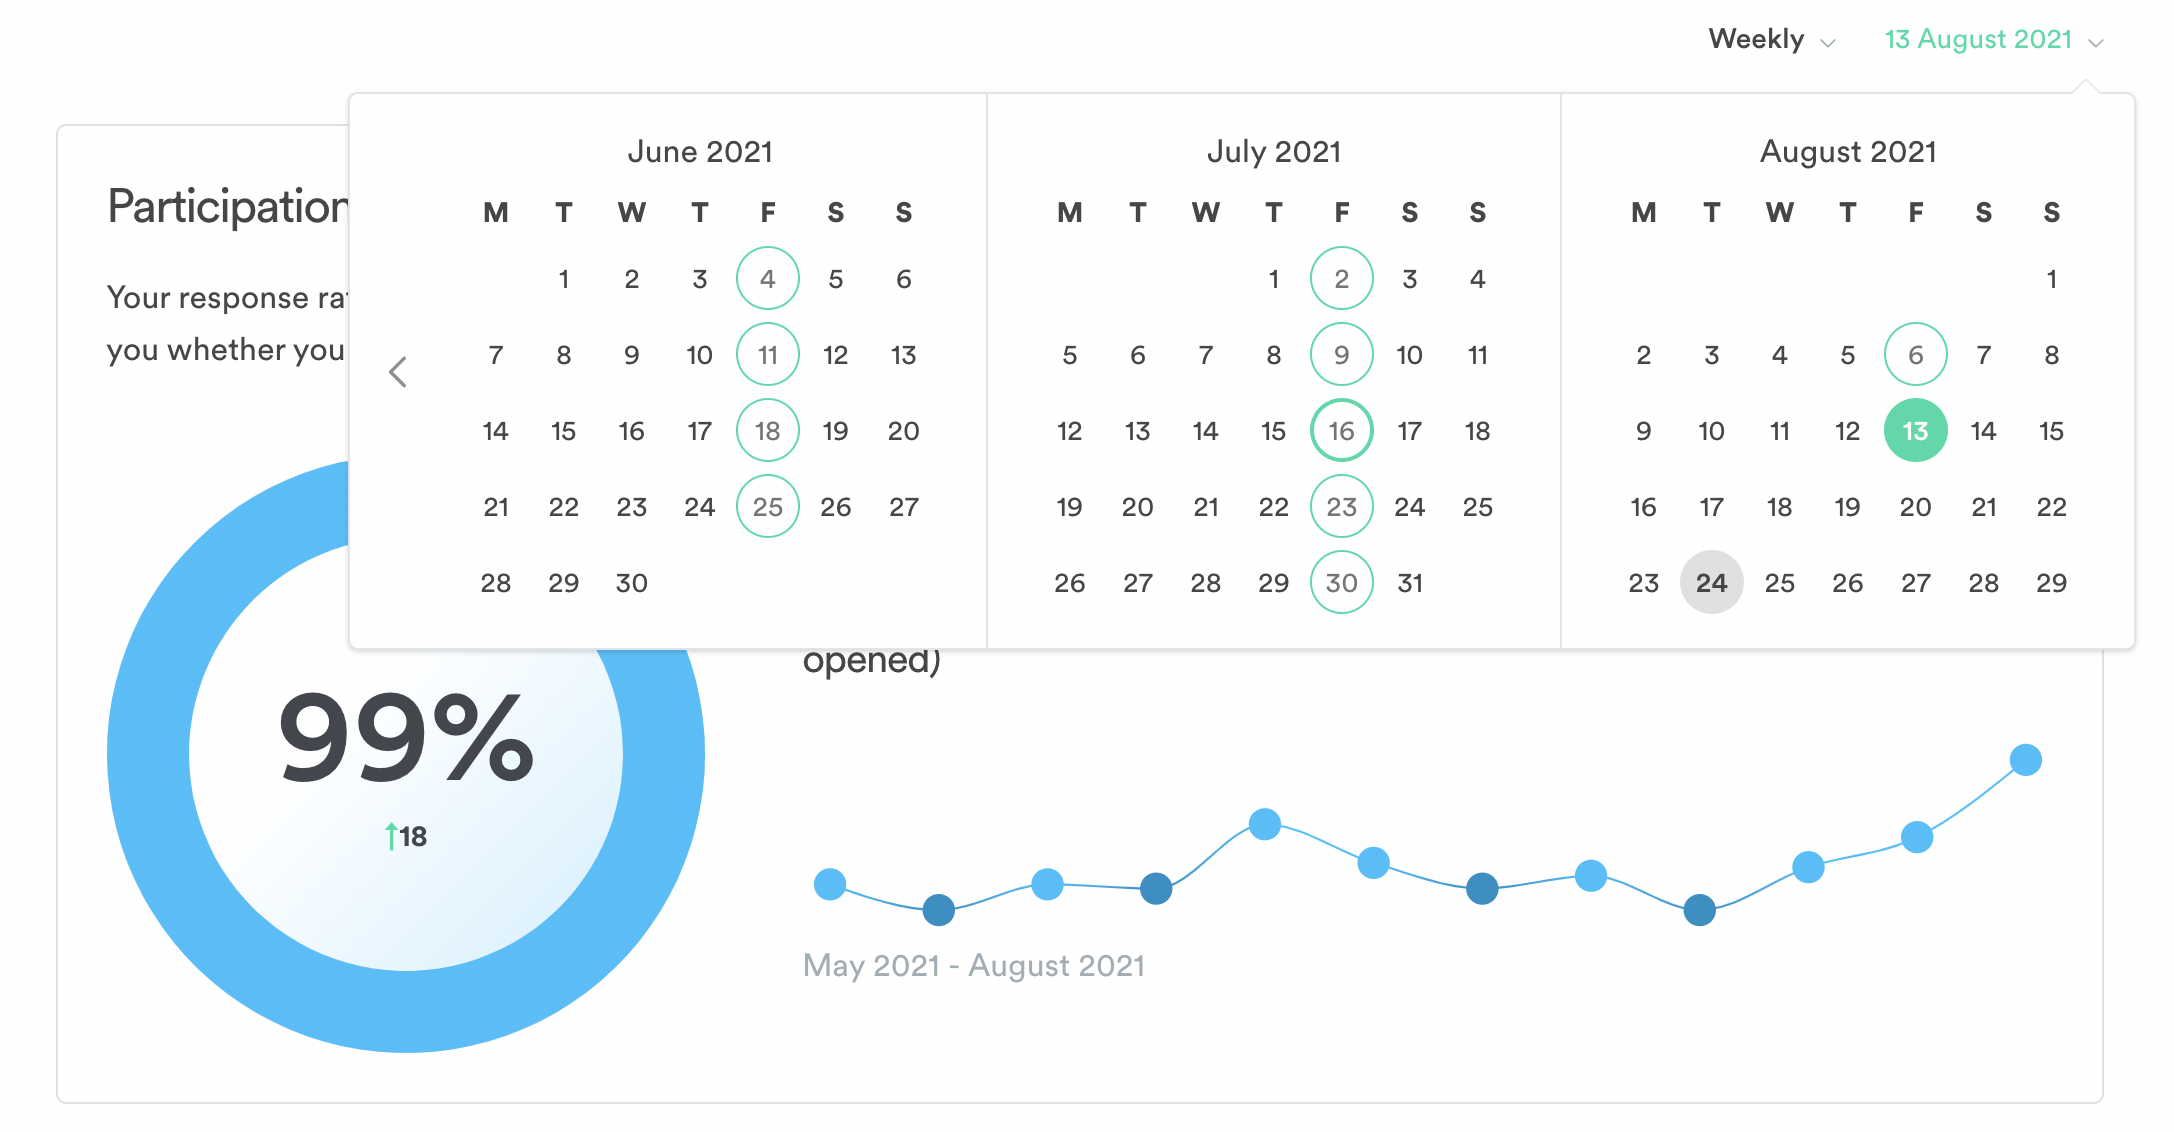
The date will be set to your most recent measure by default. To see response rates from a different week, select the date from the dropdown on the top right-hand side, or click on the date of interest on the trend line.
You can choose to see your Weekly or Quarterly response rates by clicking on the dropdown on the top right-hand side next to the date.
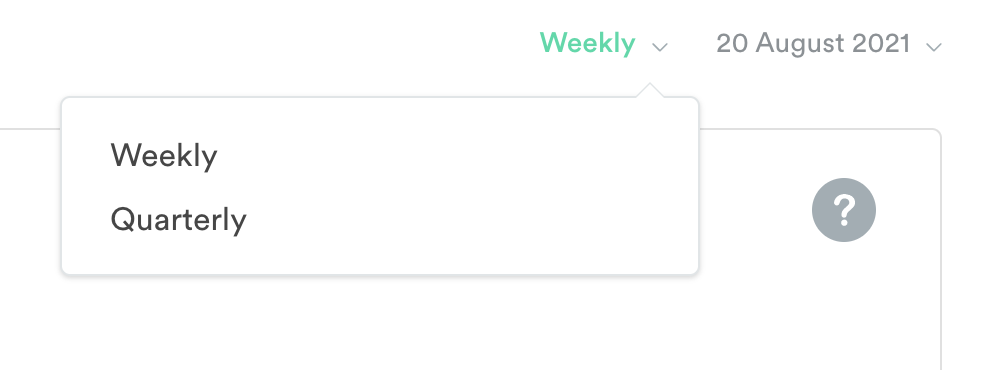
- The overall Weekly response rate reflects the number of users who answered the Happiness question at the beginning of the question flow that week.
- The overall Quarterly response rate reflects the proportion of users who answered the first question (generally Team relationships) in the Culture Profile flow during that quarterly measure.
On your Participation report, you will also find response rates for ‘High response teams’ and ‘Low response teams’, as well as an overview of all team response rates. Below that you’ll see response rates broken down by any groups or Tags information you have included in your user list. Finally, you’ll see the results for the two onboarding questions that we included in your first Culture Profile onboarding measure.
Friday Pulse records all responses a user gives, no matter if they complete the question flow or not. This means each score has its own response rate and the response rate for an early question could be slightly higher than for a later question. Response rates reflect the percentage of people in your team or organization who answered a particular question in Friday Pulse. If you would like to see response rates for specific questions in the Culture Profile you can select a topic, such as ‘Team Relationships’, on your Reports Overview page or via the Heatmap and click through to results for that specific topic.
To better understand why the Participation report provides an essential insight into your organizations’ happiness, we suggest reading our Help Center article on why response rates are important.
And if you have a low response rate, we recommend you act quickly to inspire participation. There are lots of little things you can do to elevate response rates. Read up on the basics of how to: - start with a good response rate - and boost your response rates